

The quarterly business review is fifteen minutes in, and the engineering director is walking the executive team through a project delay. The root cause was a voltage domain mismatch in the schematic, discovered during prototype bring-up. The respin cost: $11,000 in new boards, components, and assembly. That is the number on the slide. It is not the number that actually matters.
What the slide does not show is the 60 hours of senior engineering time consumed in debugging before the root cause was identified. It does not show the three weeks of firmware development that stalled while the team waited for corrected hardware. It does not show the certification timeline that shifted, the customer demo that was rescheduled, or the competing product that launched into the gap. The $11,000 is the cost that appeared on a purchase order. The true cost of that single respin was closer to $70,000, and the organization experienced a version of this story on nearly every project that year.
Earlier in this series, we examined the industry data: 2.9 respins per project on average, $44,000 per respin, 8.5 days of schedule delay per iteration [1]. This article goes beyond those headline figures to examine the full economic picture that most organizations never calculate, and provides a framework for building the internal business case for validation investment.
The true cost model: what a purchase order does not show
The $44,000 industry average represents the direct costs that most organizations track: NRE tooling charges, PCB fabrication, component procurement, and board assembly. These are real costs, and for complex designs they can be substantially higher. But they are also the easiest costs to see, which means they get the most attention while the larger expenses go unmeasured.
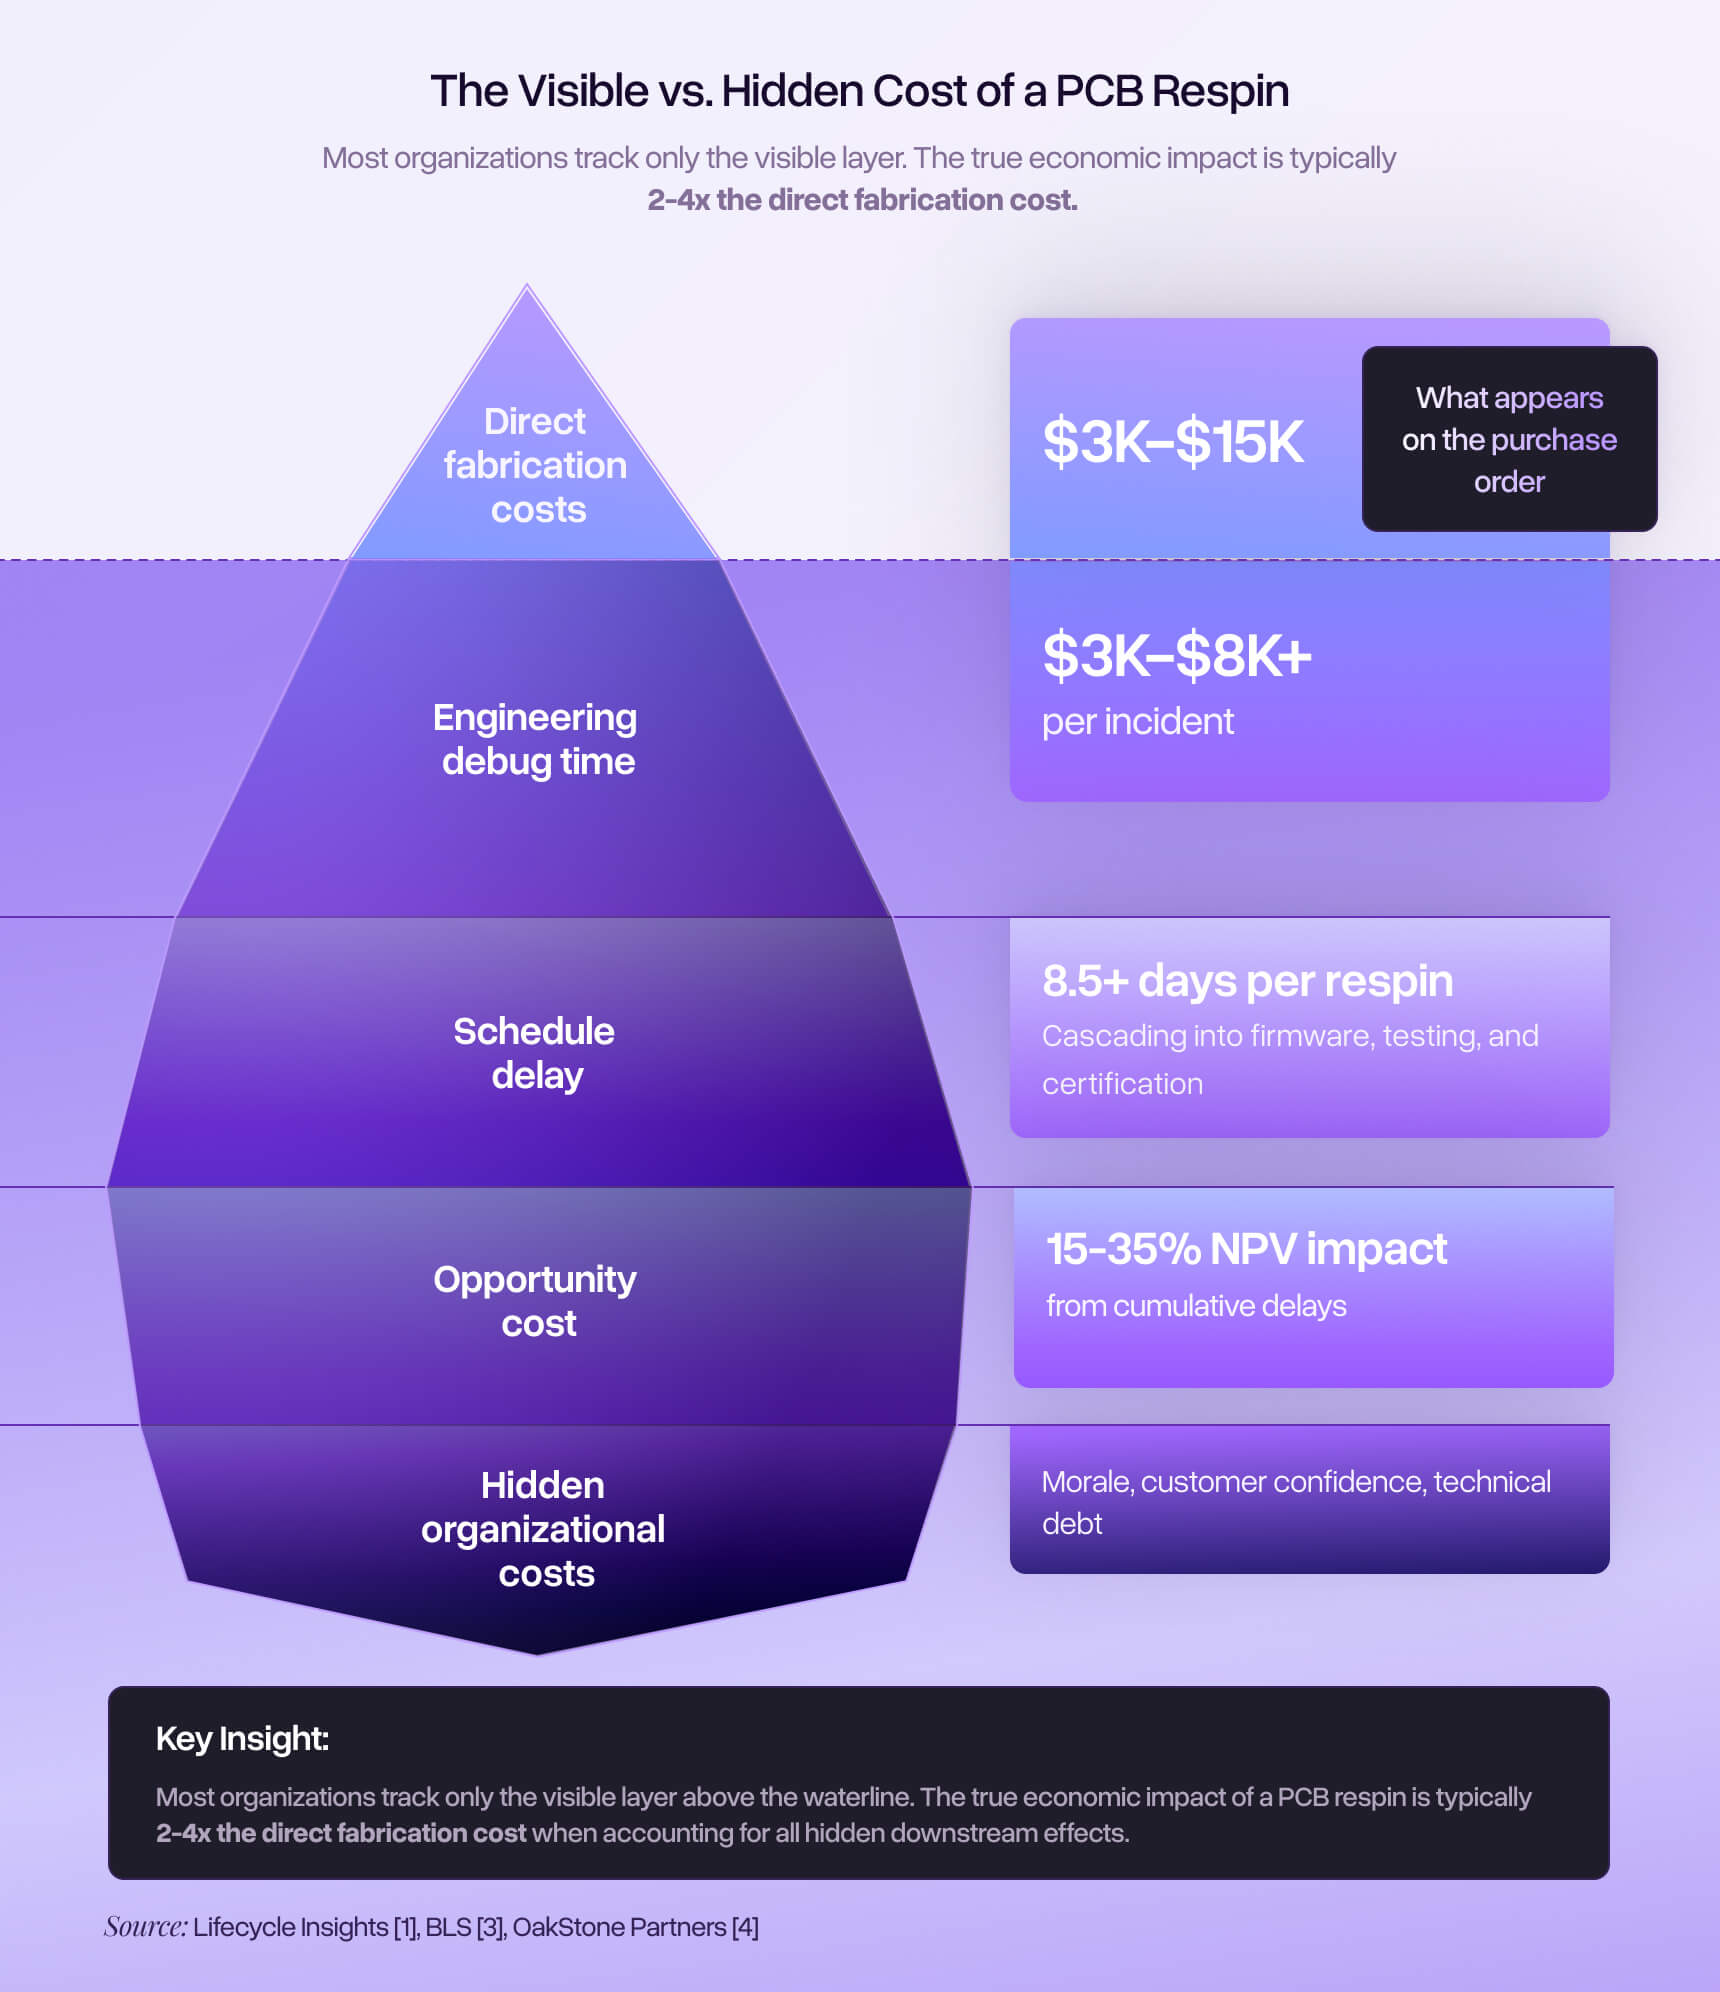
The full cost of a respin unfolds across five layers, each progressively harder to quantify and progressively larger in impact.
Direct fabrication costs are the visible layer: NRE charges for new tooling, PCB fabrication for the revised design, procurement of replacement components, and assembly. For a moderately complex board, quick-turn prototype services typically price these costs in the range of $3,000 to $15,000 per iteration, though high-density or specialized designs can run significantly higher [2].
Engineering debug time is where costs begin to compound. Before a respin can even be initiated, someone has to find the problem, and debugging a failed prototype is rarely straightforward. Symptoms often mislead: the actual root cause may be several investigative layers removed from the behavior observed on the bench. With median salaries of $112,000 to $128,000 for electrical and electronics engineers [3], the fully loaded cost of a senior hardware engineer typically runs $75 to $100 per hour or more. A debugging effort that consumes 40 to 80 hours, common for subtle schematic-level errors, adds $3,000 to $8,000 in engineering cost alone per incident.
Schedule delay costs cascade through the rest of the product development timeline. The 8.5 days of average schedule impact per respin does not occur in isolation. When a hardware respin pushes the board availability date, firmware development stalls, integration testing gets compressed, and regulatory certification timelines shift. For products with seasonal market windows or committed customer delivery dates, those delays carry real financial consequences. Research from OakStone Partners estimates that product delays can cost 15 to 35% of a product's net present value, depending on the competitive landscape and delay magnitude [4].
Opportunity costs are harder to measure but often larger in magnitude. Every hour a senior engineer spends debugging a preventable error is an hour not spent on higher-value work: the next design, architecture decisions, the technical work that differentiates an organization's products.
Hidden organizational costs are the fifth layer: team morale, customer confidence, and technical debt. Teams that experience repeated respins develop a learned helplessness around prototype success. If three respins are 'normal,' the urgency to prevent the fourth diminishes. Customer relationships erode when delivery dates slip. Technical debt accumulates when fixes are rushed to recover schedule rather than implemented properly.
Calculating your organization's respin burden
Industry averages are useful for context, but the business case that matters is the one built from your own data. Most organizations do not systematically track respin frequency, root causes, or true costs. Building an accurate picture requires answering three questions, often from data that exists only in the memories of your engineering team.
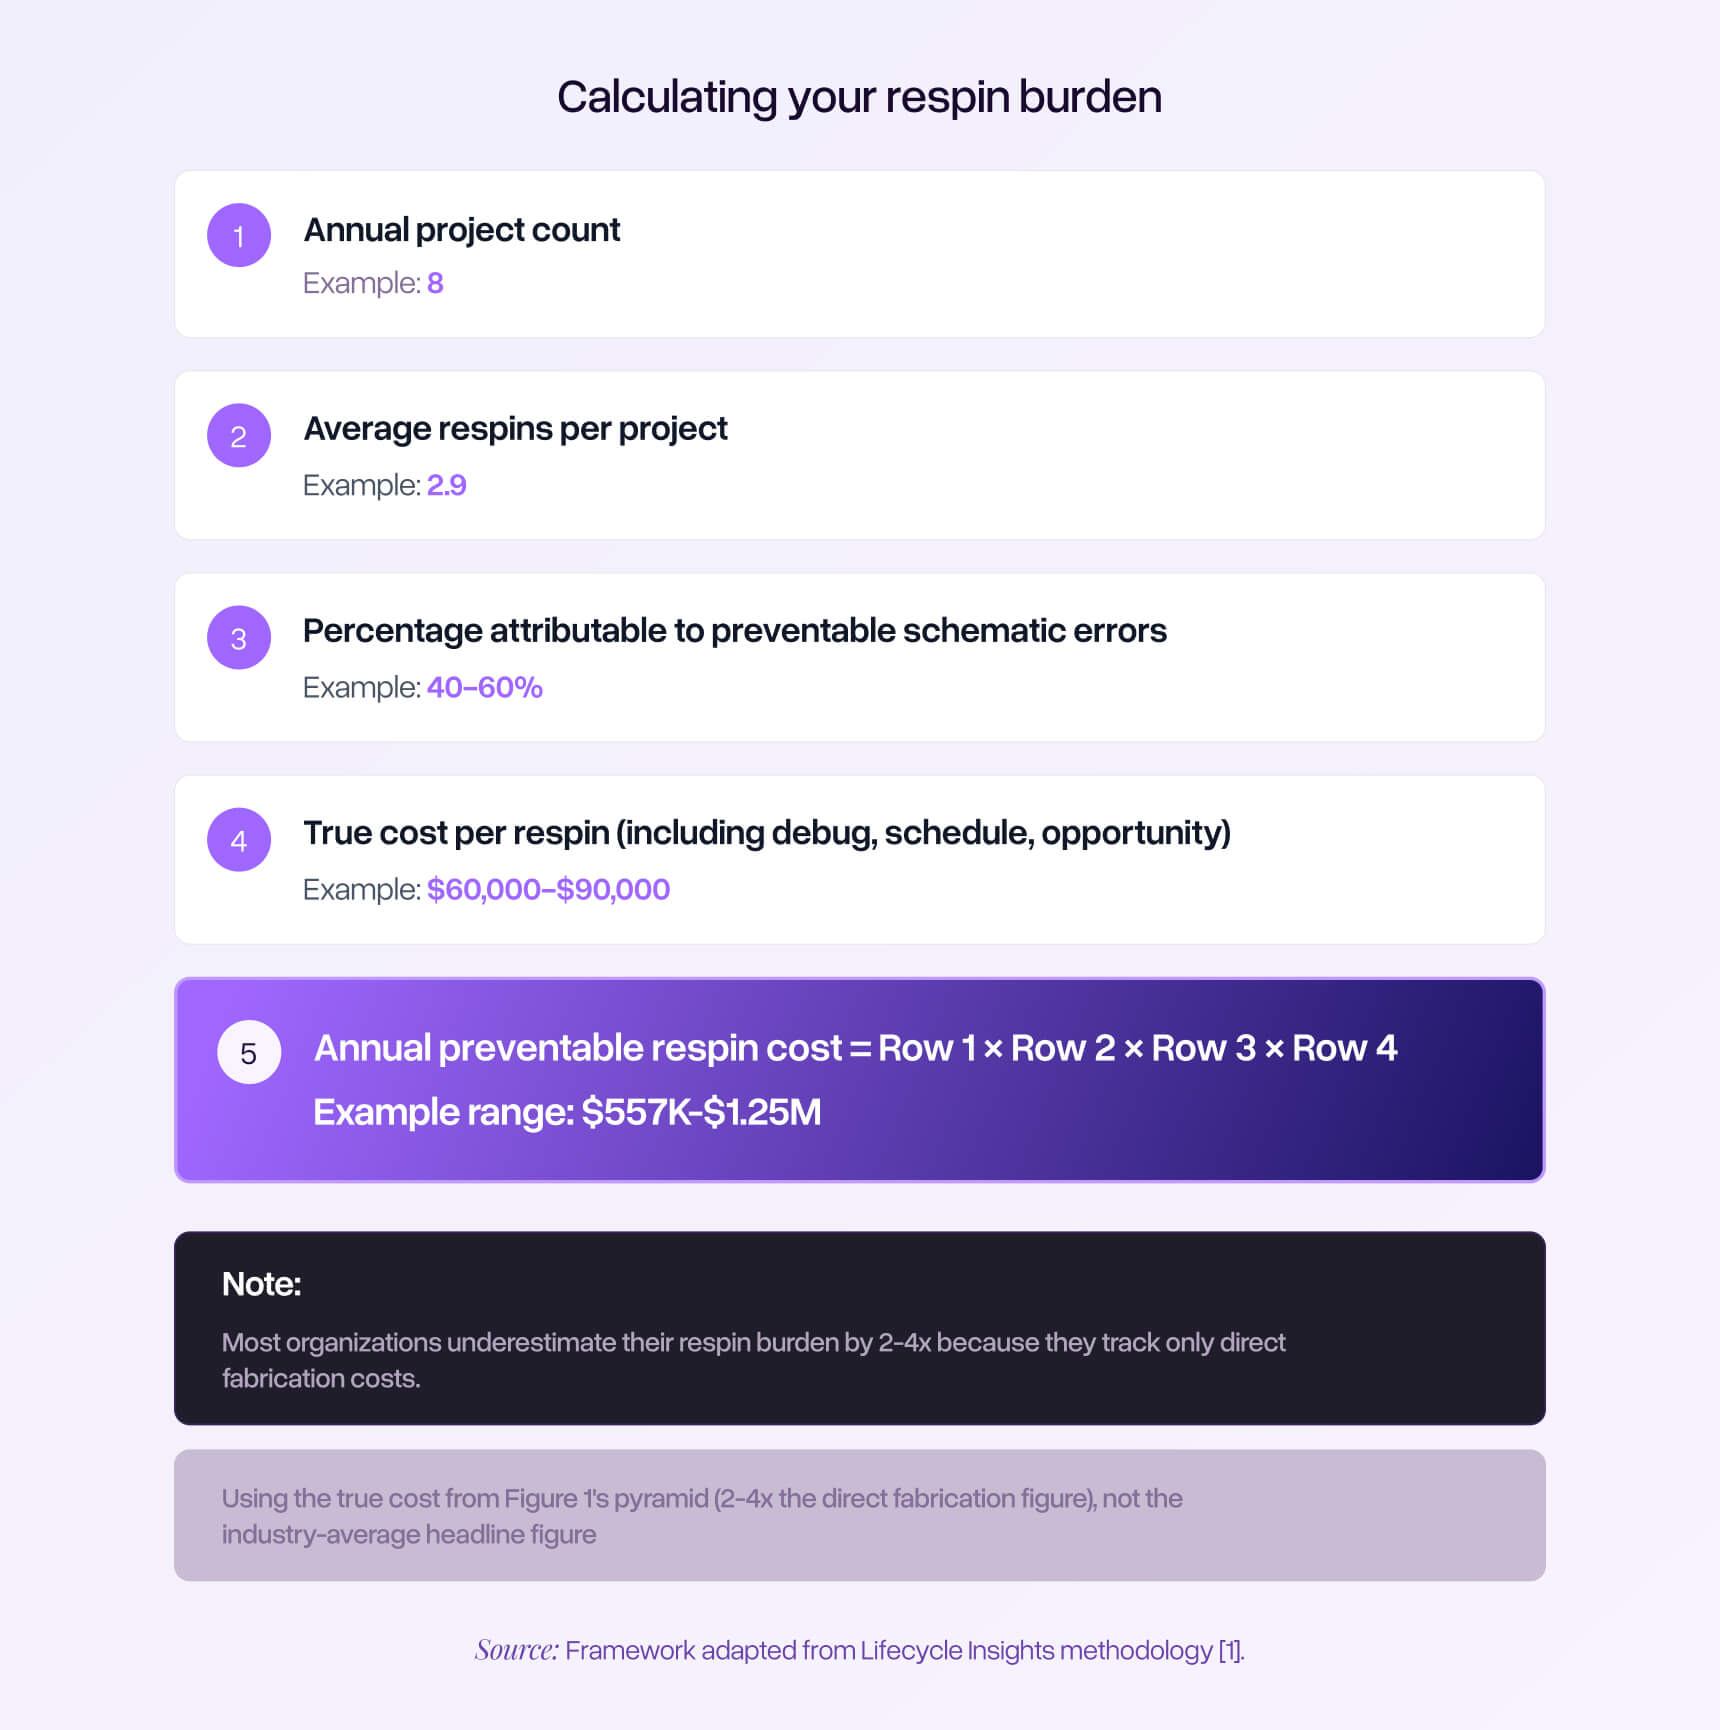
The first is frequency. How many unplanned fabrication runs did your team require across all projects in the past twelve months? Not board revisions that include deliberate design iterations, but respins driven by errors that should have been caught before files were generated. The industry average of 2.9 per project is just that — an average. Some teams operate closer to two, others closer to five.
The second is root cause distribution. A respin driven by a requirement change is fundamentally different from one caused by a voltage domain mismatch present in the original schematic. Requirement changes may be unavoidable. Schematic-level functional errors are preventable through better validation. The proportion in each category determines how much of your respin burden is actually addressable.
The third is true cost per incident: not the fabrication invoice, but the full cost including debug time, schedule impact, and downstream effects. Select three to five recent respins and reconstruct the complete cost for each. This exercise almost always produces a per-respin figure two to four times the direct fabrication cost alone.
With these three data points, the calculation becomes straightforward. Multiply your annual respin count by the proportion attributable to preventable schematic errors, then multiply by your true cost per respin. That is the annual cost your organization pays for inadequate schematic validation. For many mid-sized teams, this number falls between $300,000 and $1 million.
The capacity perspective: validation as a force multiplier
Cost reduction is the obvious lens through which to evaluate validation investment, but it is not the most strategically important one. The more consequential question is about engineering capacity.
Senior hardware engineers are among the most constrained resources in any product development organization. They are expensive to hire, slow to ramp up, and difficult to retain in a labor market where demand consistently outpaces supply. The Electronic Design 2024 salary survey found that median compensation for electronics engineers and tech professionals fell in the $125,000 to $150,000 range, with more than 40% earning above $150,000 [5]. Organizations compete aggressively for this talent, and once they have it, how that talent spends its time becomes a critical strategic question.
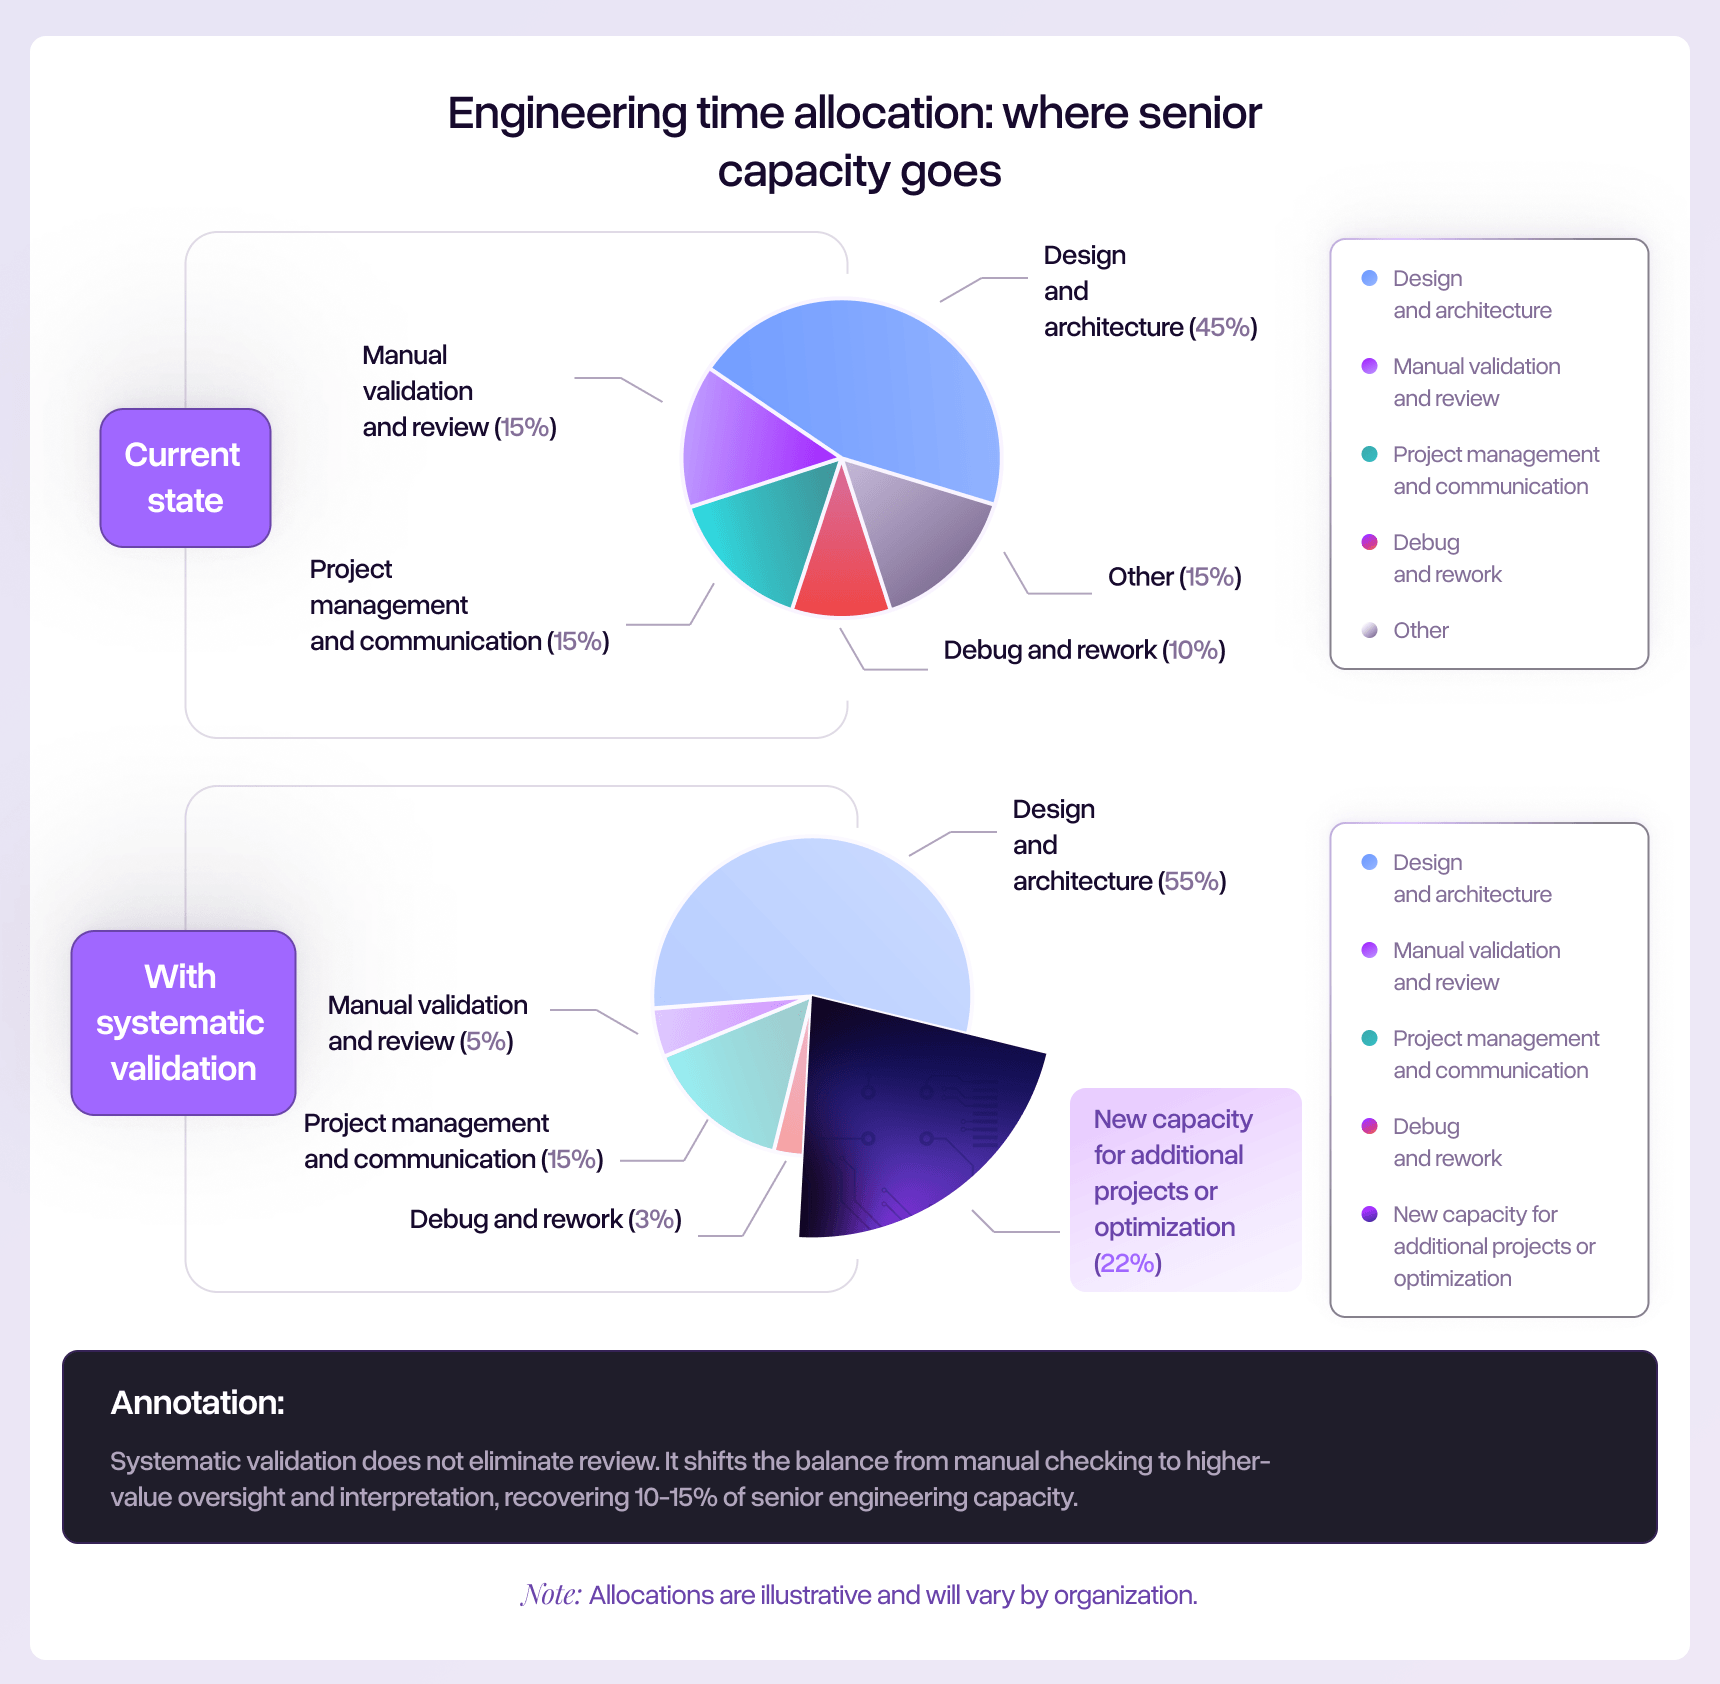
Consider how much of your senior engineers' time is currently consumed by activities that could be described as 'checking work that should have been right the first time.' Manual spec verification, where an engineer methodically cross-references pin configurations, voltage levels, current ratings, and signal polarities against datasheets, is essential work. But it is also repetitive, cognitively exhausting, and poorly matched to the strengths that make senior engineers valuable. The same is true of debugging preventable errors on the bench: highly skilled professionals spending days or weeks tracing through symptoms to find root causes that were present in the schematic from the beginning.
If your team of eight engineers spends an average of 10% of their time on manual validation tasks and another 5% debugging preventable errors, that represents the equivalent of 1.2 full-time engineers whose capacity is consumed by work that better validation processes could substantially reduce. For a team with a $1.2 million annual salary budget, that is roughly $180,000 in engineering capacity currently allocated to activities that, while essential, could be accomplished far more efficiently through systematic approaches.
This framing tends to resonate more strongly with executive stakeholders than cost reduction alone. Cost reduction is incremental. Capacity recovery is strategic. It connects validation investment directly to an organization's ability to take on more projects, move faster, and compete more effectively — without the risk, expense, and lead time of hiring additional headcount.
The economics of prevention
Quality management theory has long established a principle widely applied in total quality management known as the 1-10-100 rule: every dollar invested in prevention saves roughly ten dollars in correction costs and one hundred dollars in failure costs [6]. The exact ratios vary by industry and application, but the underlying principle — that the cost of addressing a problem increases by an order of magnitude at each subsequent stage of the product lifecycle — has been validated repeatedly across manufacturing, software, and product development.
Applied to PCB design, the stages are concrete. Correcting a voltage domain mismatch during schematic review requires a few minutes of editing in the EDA tool: effectively zero cost. Discovering the same error during prototype bring-up transforms a five-minute fix into a 40-to-60-hour debugging campaign at $85 per hour, plus $8,000 or more in scrapped boards and replacement fabrication, plus two weeks of schedule delay and its downstream cascade. A conservative estimate for a single escaped voltage mismatch: $12,000 to $15,000 in total impact, for an error that cost nothing to prevent.
The prevention economics for schematic validation are particularly favorable for a straightforward reason: the cost of fixing a schematic error before fabrication is negligible. Unlike manufacturing process improvements that require capital equipment, or software quality initiatives that require architectural changes, a schematic correction identified before fab files are generated costs only the minutes required to update the design. The full cost of the respin is avoided entirely.
This means that the break-even calculation for any validation investment is straightforward. If the annual cost of the validation approach is less than the cost of a single prevented respin, the investment pays for itself with the first error caught. Given that the true cost of a respin typically ranges from $44,000 to well over $100,000 for complex designs, the threshold for positive ROI is notably low.
Building the business case: a framework for engineering leaders
The internal business case for validation investment needs to accomplish three things: quantify the problem in terms the organization already tracks, demonstrate ROI under conservative assumptions, and propose an approach that minimizes adoption risk.
Quantifying the problem means translating the respin burden into the metrics your executive team already cares about. Development cost per project, on-time delivery percentage, and engineering utilization are common starting points. If your organization tracks these metrics, the respin impact can be expressed directly: 'Preventable respins added an average of $X to development cost per project last year, contributed to Y% of our schedule overruns, and consumed Z engineering-days that could have been allocated to new product development.'
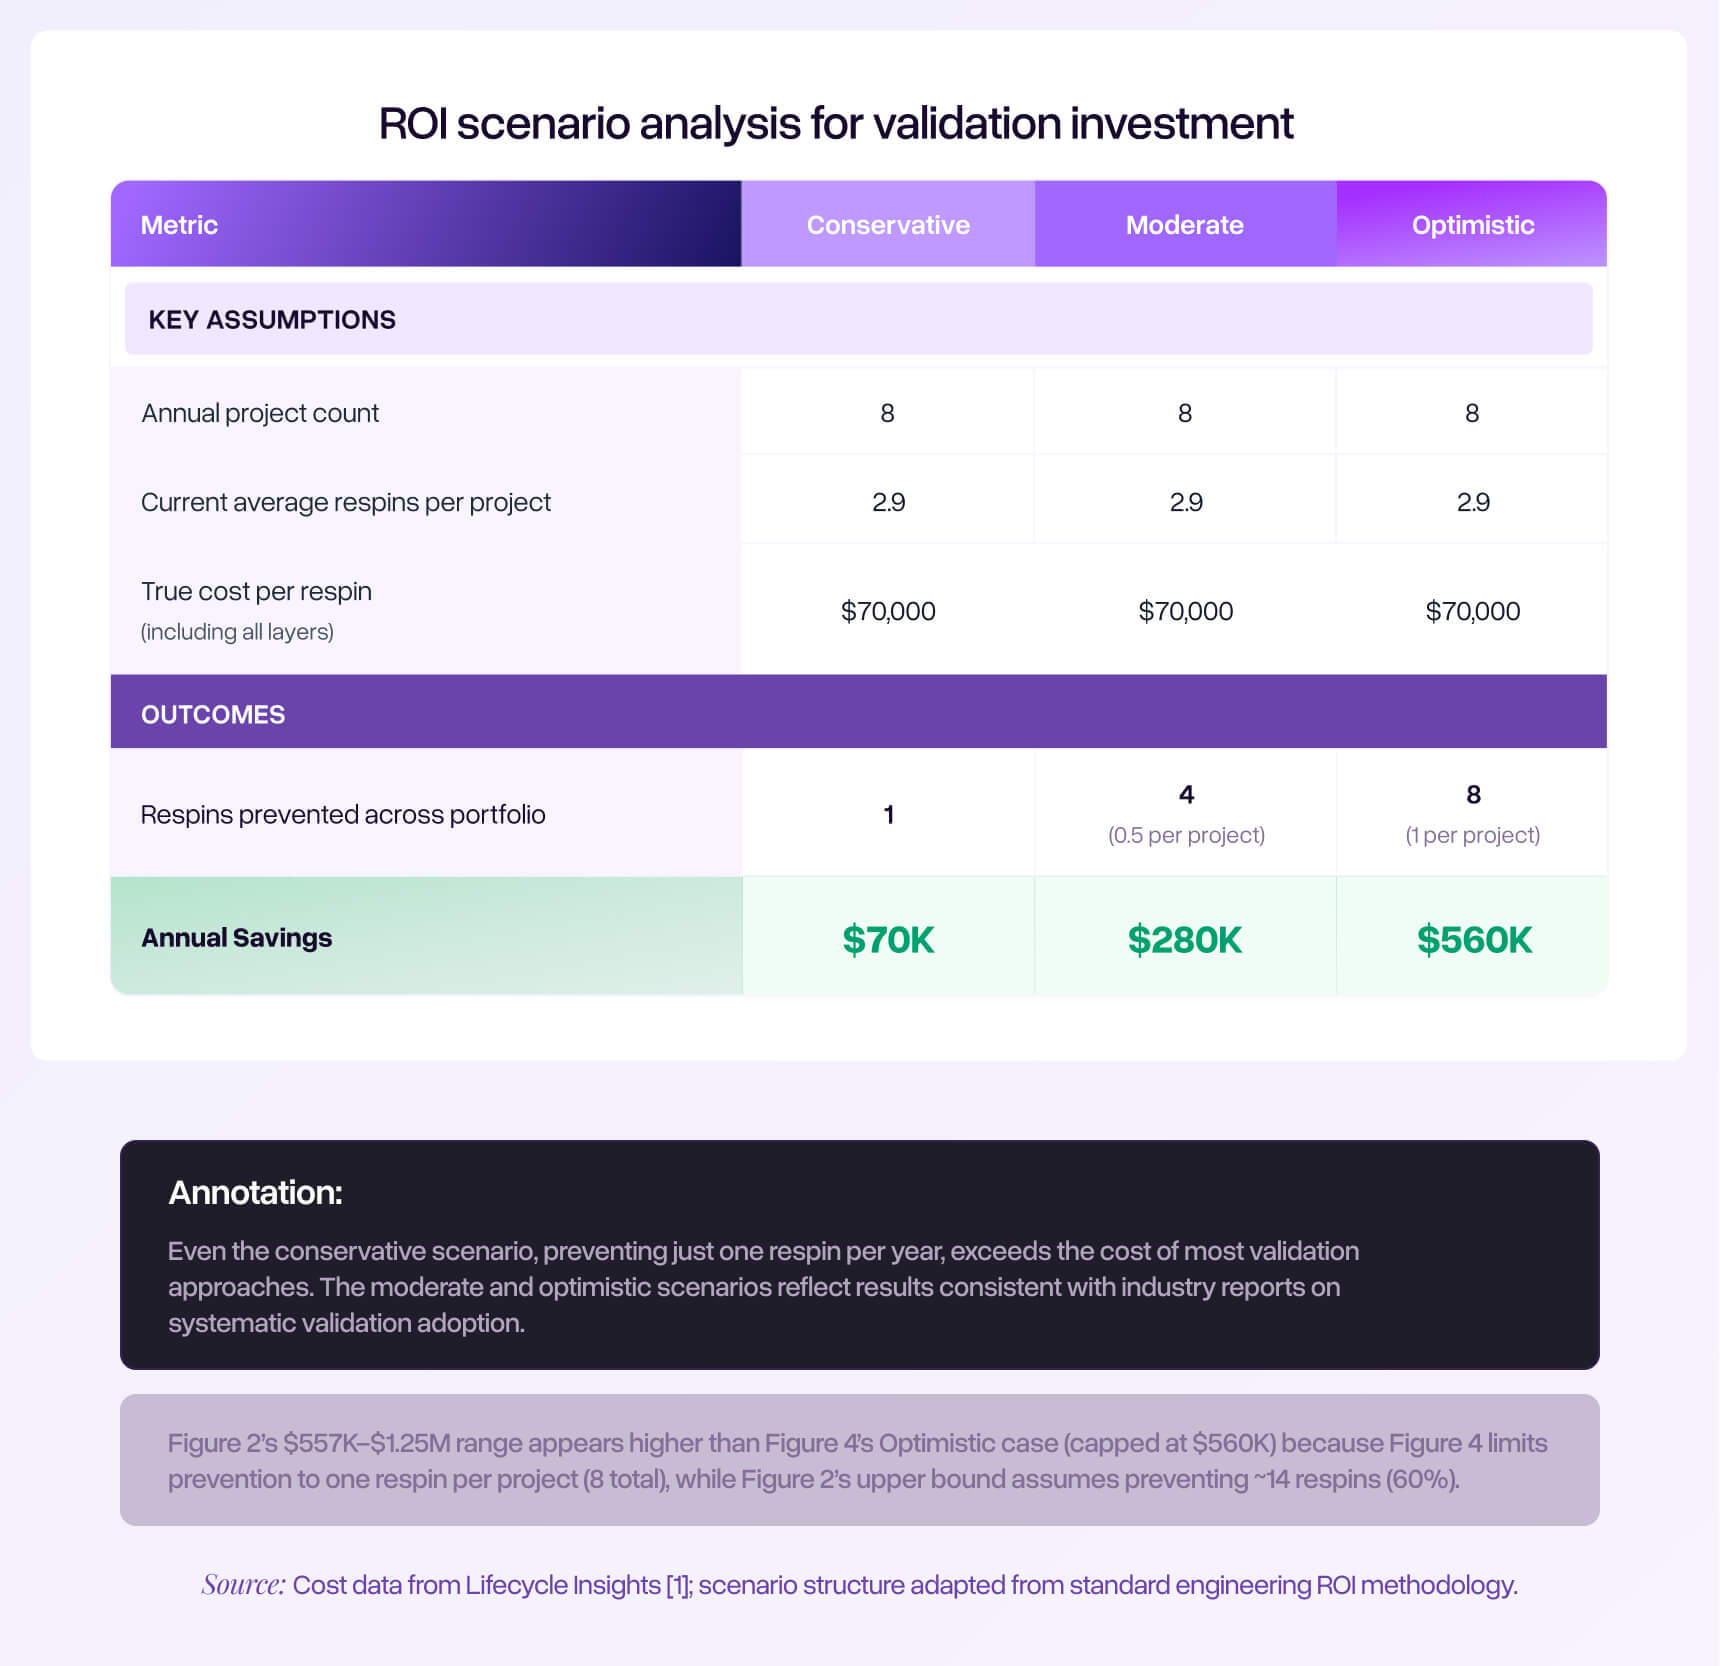
Demonstrating ROI under conservative assumptions is critical because most executives have seen optimistic projections that failed to materialize. The strongest business cases use deliberately pessimistic assumptions and still show compelling returns. Consider a scenario analysis structured around three cases: a conservative case where validation prevents one additional respin per year across the entire portfolio, a moderate case where it prevents one respin per every two to three projects, and an optimistic case where it reduces average respins per project by a full iteration. Even the conservative case -- preventing a single respin at a true cost of $60,000 to $90,000 — likely exceeds the annual cost of most validation approaches and produces a payback period measured in weeks rather than months.
Minimizing adoption risk means proposing a pilot rather than an organization-wide commitment. Select two or three upcoming projects with characteristics that make them good candidates: moderate to high complexity, experienced engineers who can provide informed feedback, and timelines that allow for meaningful before-and-after comparison. Define success metrics in advance: errors caught that would not have been found through existing processes, engineering time saved or redirected, and respin reduction relative to historical baselines.
Communicating to executive stakeholders
Engineering leaders often struggle to secure investment in validation because the conversation defaults to technical territory that non-technical executives cannot evaluate. The shift required is framing validation not as a technical tool but as a risk management strategy with measurable financial returns.
Three framing principles tend to be effective.
First, connect to business outcomes, not engineering processes. Executives do not need to understand the difference between DRC and schematic-level validation. They need to understand that a definable category of preventable errors is adding a quantifiable cost to every project, and that a structured approach can reduce that cost with high confidence. The language of risk management is more effective than the language of engineering methodology: 'We have identified a category of design risk that costs us approximately $X per year. We are proposing a $Y investment to mitigate that risk, with an expected return of Z within the first twelve months.'
Second, address the objection before it is raised. The two most common executive objections are 'our engineers are careful' and 'we already do design reviews.' Neither objection is wrong, and neither is sufficient. As we explored earlier in this series, even experienced engineers working carefully miss a predictable fraction of errors when performing complex inspection tasks under real-world conditions [8]. Design reviews operate under time pressure and face the same cognitive constraints as any manual process. The business case should acknowledge the quality of existing practices while framing validation investment as addressing a gap that no amount of individual diligence can fully close.
Third, propose measurement, not faith. The strongest position an engineering leader can take is: 'I believe this investment will pay for itself within the first quarter. I am proposing a structured pilot with predefined success metrics so we can verify that belief with real data before committing further. If the pilot does not demonstrate measurable value, we stop.' This approach converts what feels like a speculative expenditure into a controlled experiment with defined outcomes and limited downside.
Measuring success: leading and lagging indicators
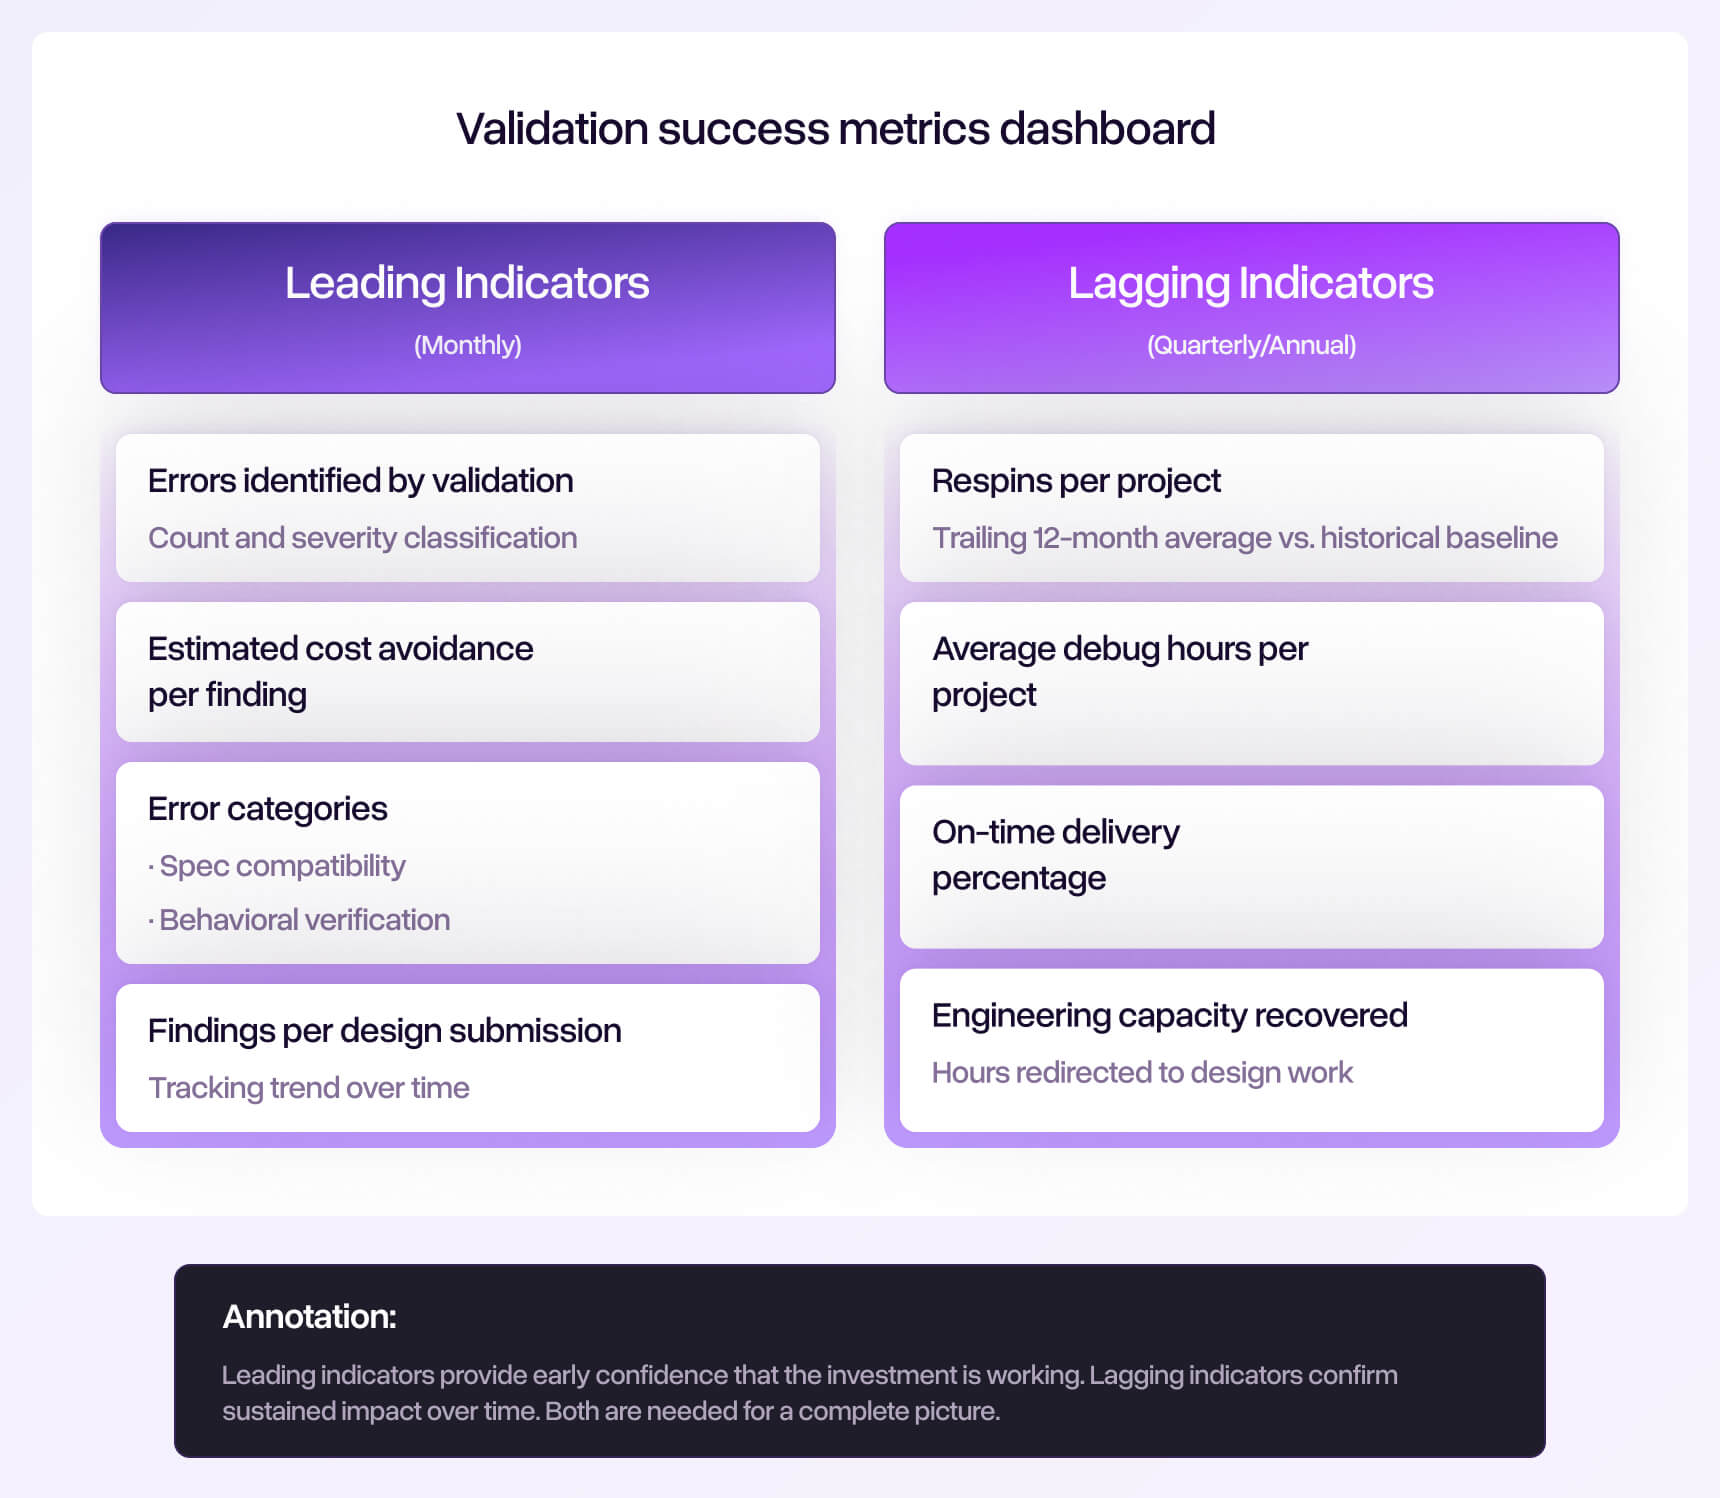
Once a validation investment is in place, measuring its effectiveness requires tracking both leading indicators and lagging indicators.
Leading indicators include the number and severity of errors identified through the validation process that would not have been caught by existing methods. Track each finding with an estimated cost-avoidance figure based on what the error would have cost if it had escaped to prototyping. Within the first few projects, this data builds a concrete record of prevented costs.
Lagging indicators include the respin rate itself, measured over a sufficient sample of projects to account for natural variation. Most organizations should plan for at least six to twelve months of data before drawing conclusions, as individual project outcomes are influenced by many factors beyond validation. Other lagging indicators worth tracking: average debug time per project, on-time delivery percentage, and engineering team feedback on workflow impact and confidence levels.
Set expectations clearly at the outset: validation investment does not eliminate all respins. Requirement changes, supply chain disruptions, and genuinely novel technical challenges will continue to drive design iterations. The goal is to eliminate the preventable errors. Reducing those to near zero is a realistic objective. Eliminating all respins is not, and claiming otherwise undermines credibility.
The economics of PCB respins are not ambiguous. The costs are large, well documented, and disproportionately driven by errors that are preventable through systematic validation. The case for investing in better validation is not a case for spending more money. It is a case for redirecting a fraction of what your organization already spends on correction toward prevention, while simultaneously recovering engineering capacity and protecting project schedules.
The organizations that will gain the most advantage are the ones that stop treating preventable errors as an inevitable cost of hardware development and start treating them as a process gap with a measurable solution. The final article in this series examines what that solution looks like at an industry level: the forces driving hardware validation forward, the lessons from other engineering disciplines that have already made this transition, and what integrated validation will mean for how hardware teams work.
References
- 'Modern Practices in PCB Design Verification,' Design World Online, citing Lifecycle Insights research, September 2018. The study found typical projects average 2.9 respins at $44,000 per respin with 8.5 days of schedule delay.
- Direct prototype costs estimated from published pricing for quick-turn PCB fabrication and assembly services. NRE tooling, fabrication, component procurement, and assembly for a moderately complex 4-6 layer board typically total $3,000 to $15,000 per iteration. Sources: Sierra Circuits, Advanced Circuits, and PCBCart published prototype pricing guides.
- U.S. Bureau of Labor Statistics, Occupational Employment and Wage Statistics, May 2024. Median annual wage: $111,910 for electrical engineers, $127,590 for electronics engineers (except computer).
- OakStone Partners, cited in 'What Are Late Product Launches Really Costing You?' Supply and Demand Chain Executive. Product delays can cost 15-35% of net present value depending on competitive landscape and delay magnitude.
- 'Survey: Salaries Trend Up for Electrical and Electronics Engineers in 2024,' Electronic Design, December 2024. Median compensation in the $125,000-$149,999 range, with more than 40% earning above $150,000.
- The 1-10-100 Rule is a principle widely applied in Total Quality Management (TQM). The principle builds on cost-of-quality frameworks developed by Joseph Juran, Philip Crosby, and Armand Feigenbaum. See: Juran, J.M., 'Juran's Quality Handbook,' 5th Edition, 1999.
- 'Cost of Quality,' American Society for Quality (ASQ). According to ASQ's framework, the cost of poor quality typically represents 15-20% of sales revenue.
- Drury, C.G. and Fox, J.G. (1975). Human reliability in quality control. Cited in 'The Role of Visual Inspection in the 21st Century,' U.S. Department of Energy, OSTI. Complex inspection tasks exhibit error rates of 20-30%.